
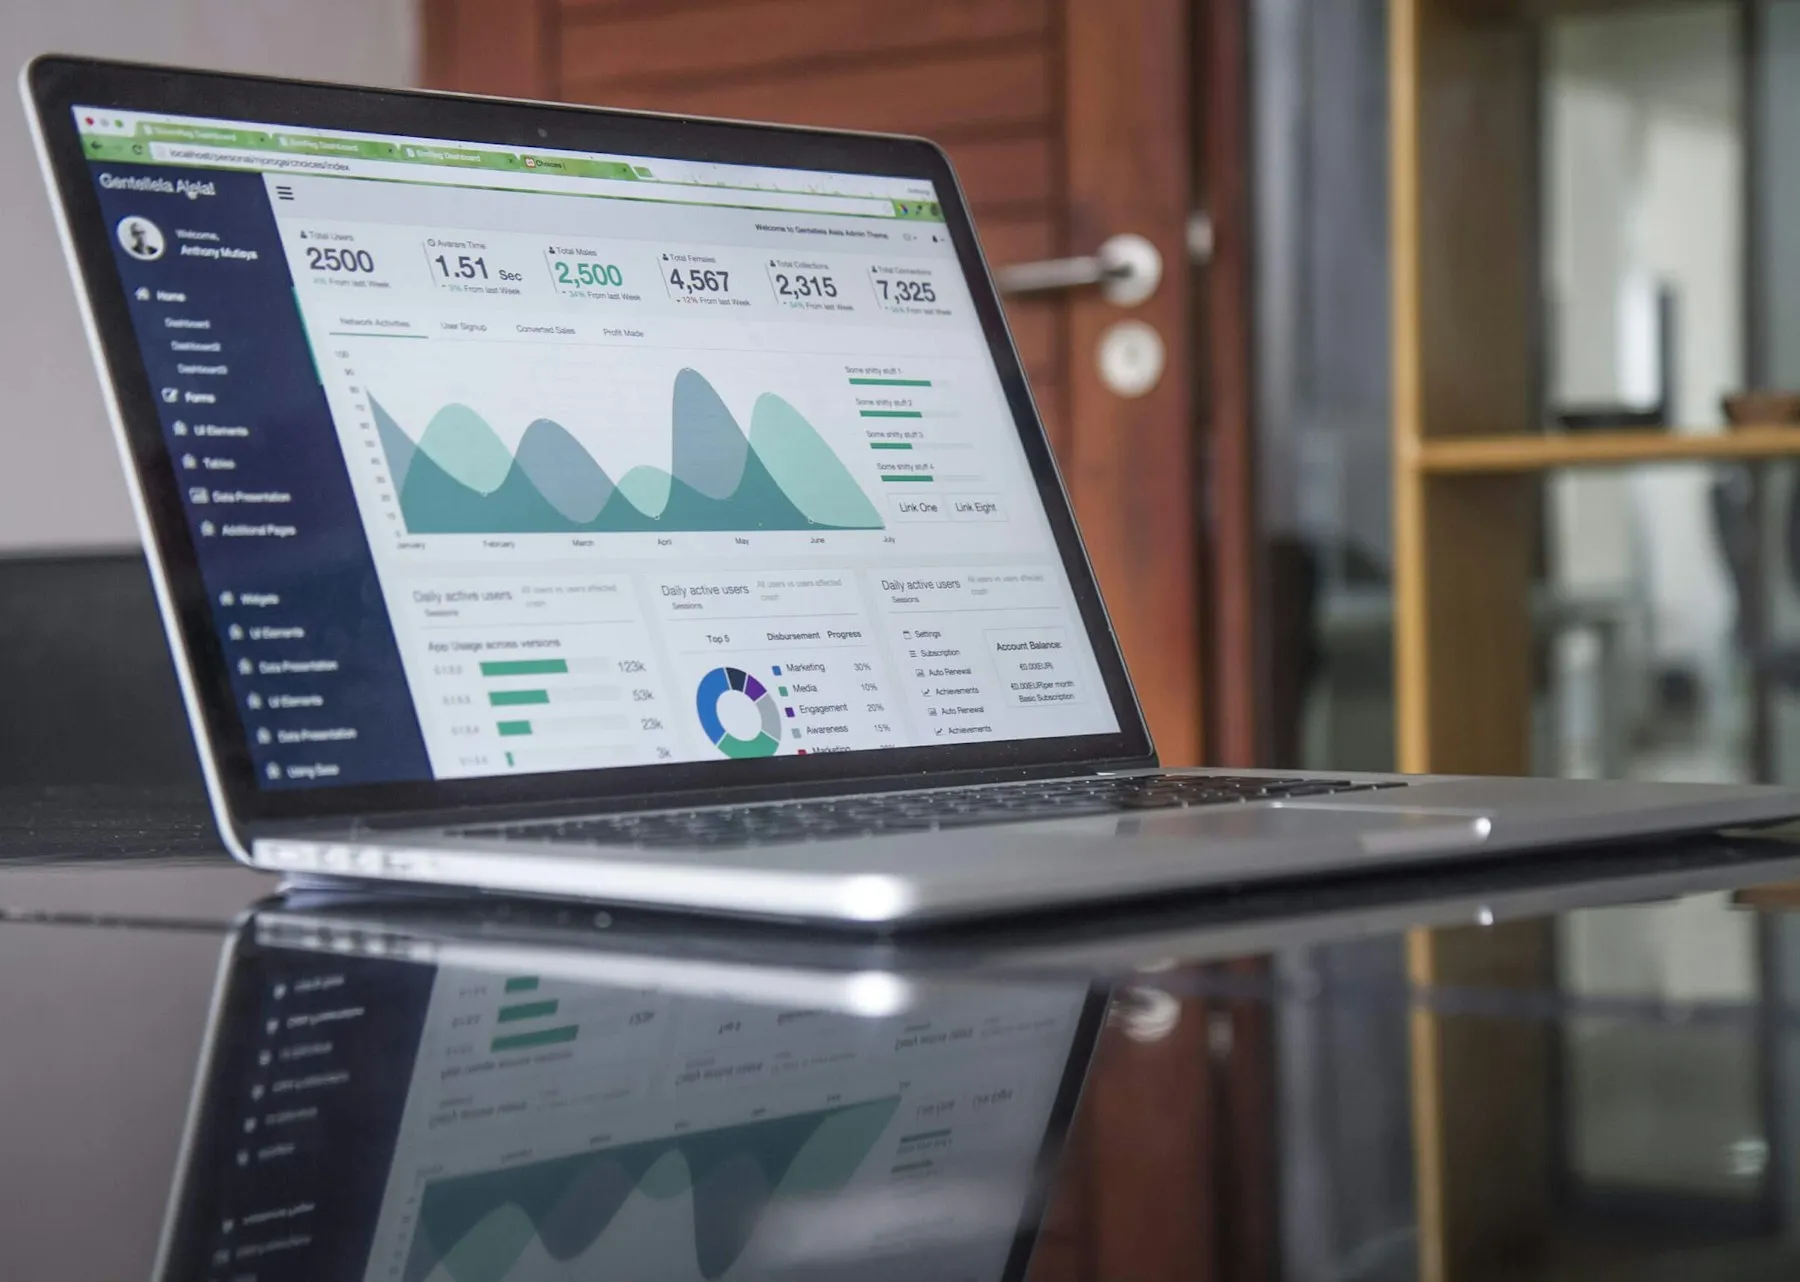

Half of every Monday goes on copying numbers.
Someone copies figures from three systems into one spreadsheet. Scheduled imports do it instead, and a failed import is flagged on the dashboard.
One view of the numbers you already have. Numbers from your store, accounting, booking system, analytics and spreadsheets in one view, with agreed definitions, a dashboard that refreshes itself and scheduled reports.
All your data in Google Analytics and one spreadsheet? A free tool such as Looker Studio is enough.
Honest before clever
Next in Build
Marketplaces & Platforms
Platforms where buyers pay sellers, with payments built in.
What it is
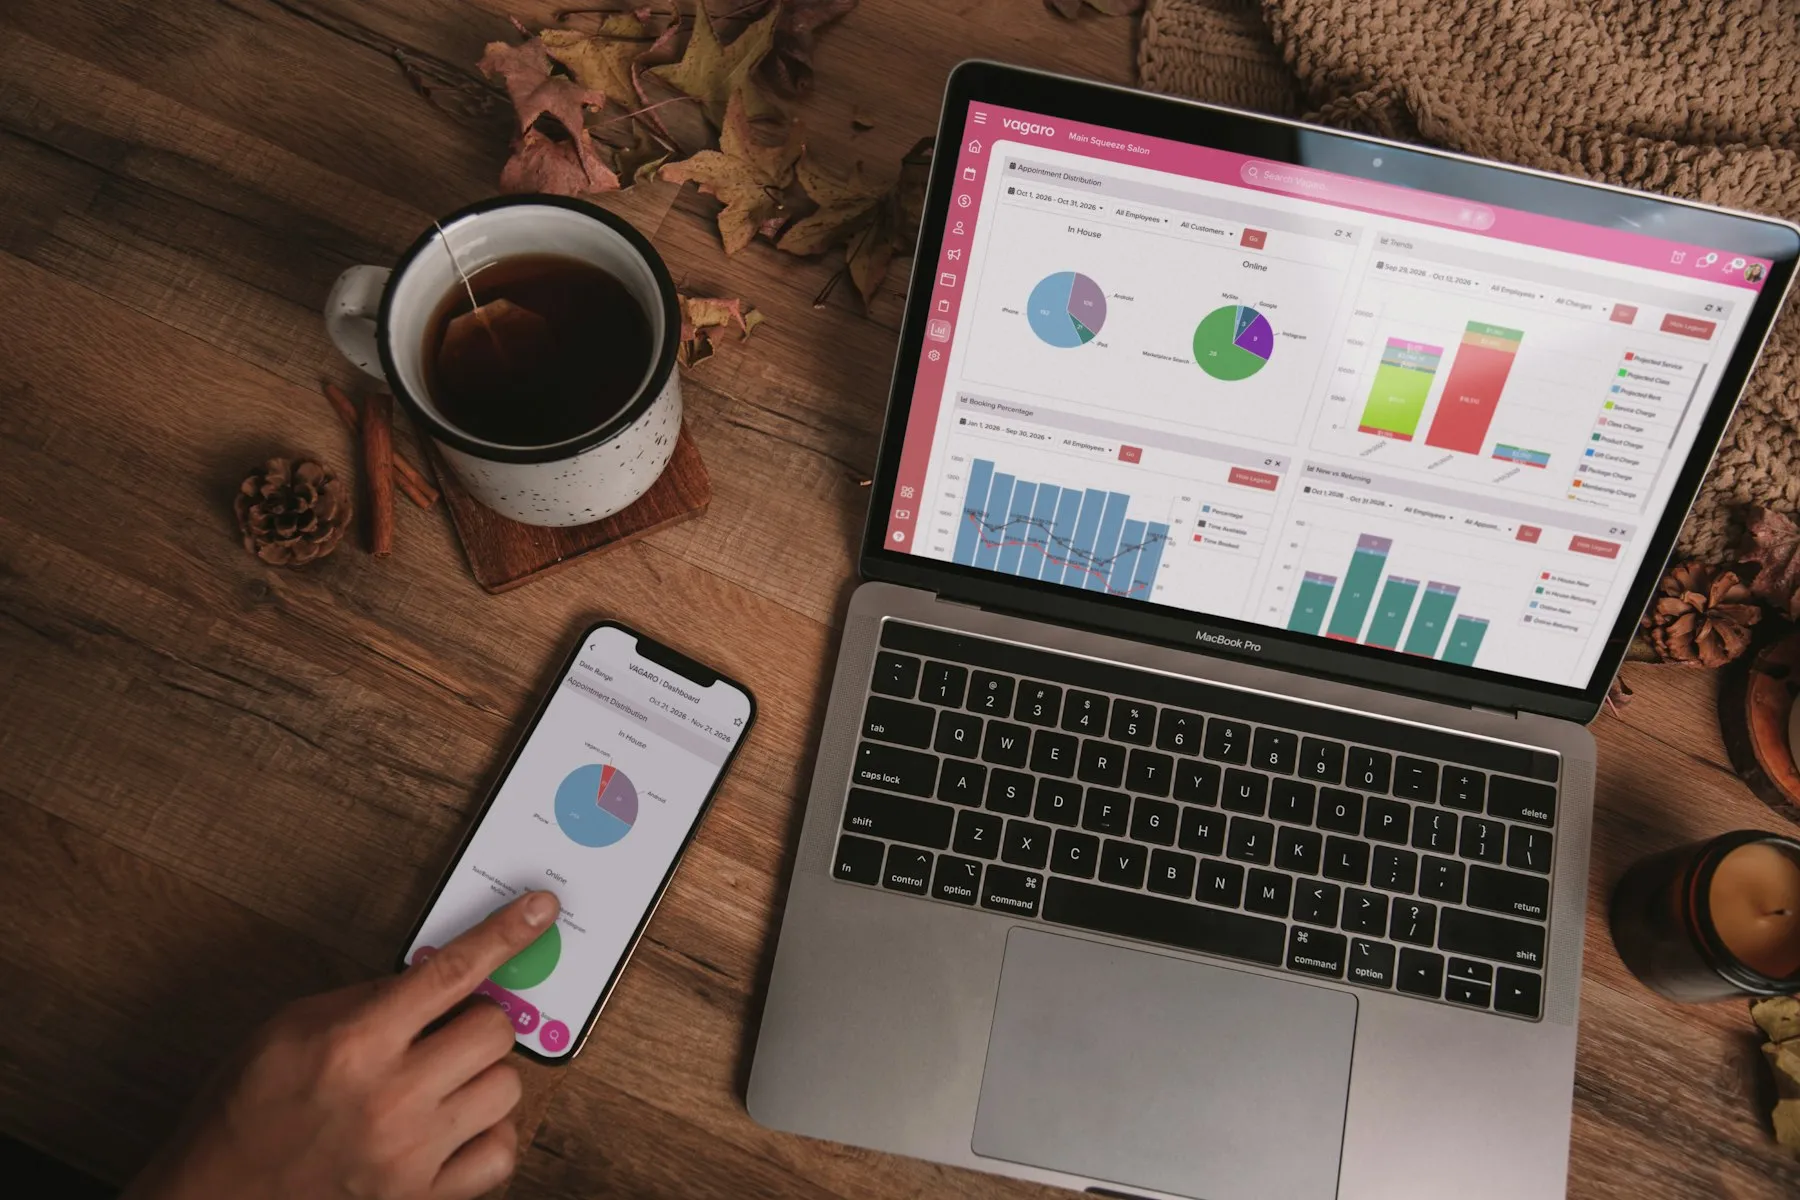
Dashboards and reporting means pulling the numbers you already have, from your store, accounting package, booking system, analytics and spreadsheets, into one up-to-date view.
You get agreed definitions for each number, a dashboard that refreshes on its own, and scheduled reports and exports. We build them into platforms we run. Examples: the AI spend dashboard of our own product Estimonia, and the finance and exam tracking in Senfoni Koçluk's coaching platform.
Dashboards & Reporting is a read-only view of data you already have: it changes what you can see, not how work is done. If the data does not exist yet, start with Custom Platforms & Portals. To move numbers between systems, see Process Automation & Integrations. To ask questions of your documents, see Retrieval Over Private Data.
Ready-made reporting tools or custom? Looker Studio, Power BI or Metabase win when the data is clean and someone keeps the reports up. Custom wins when the logic is specific to you, people must see only their own slice, or data from several systems must be combined first.
What we already know
01
"Revenue" can be gross or net, before or after refunds and VAT, by order date or payment date. Even "today" depends on the time zone. A disputed number on a beautiful chart is worse than a spreadsheet.
02
Cookie banners and ad blockers make analytics miss some orders. So money comes from your order database, and analytics is used for visitor behaviour.
03
A sync that stopped on Thursday still draws a confident chart on Monday. So failed imports raise an alert. On Estimonia, every AI call is logged with its cost before its answer is processed, so failed calls count too.
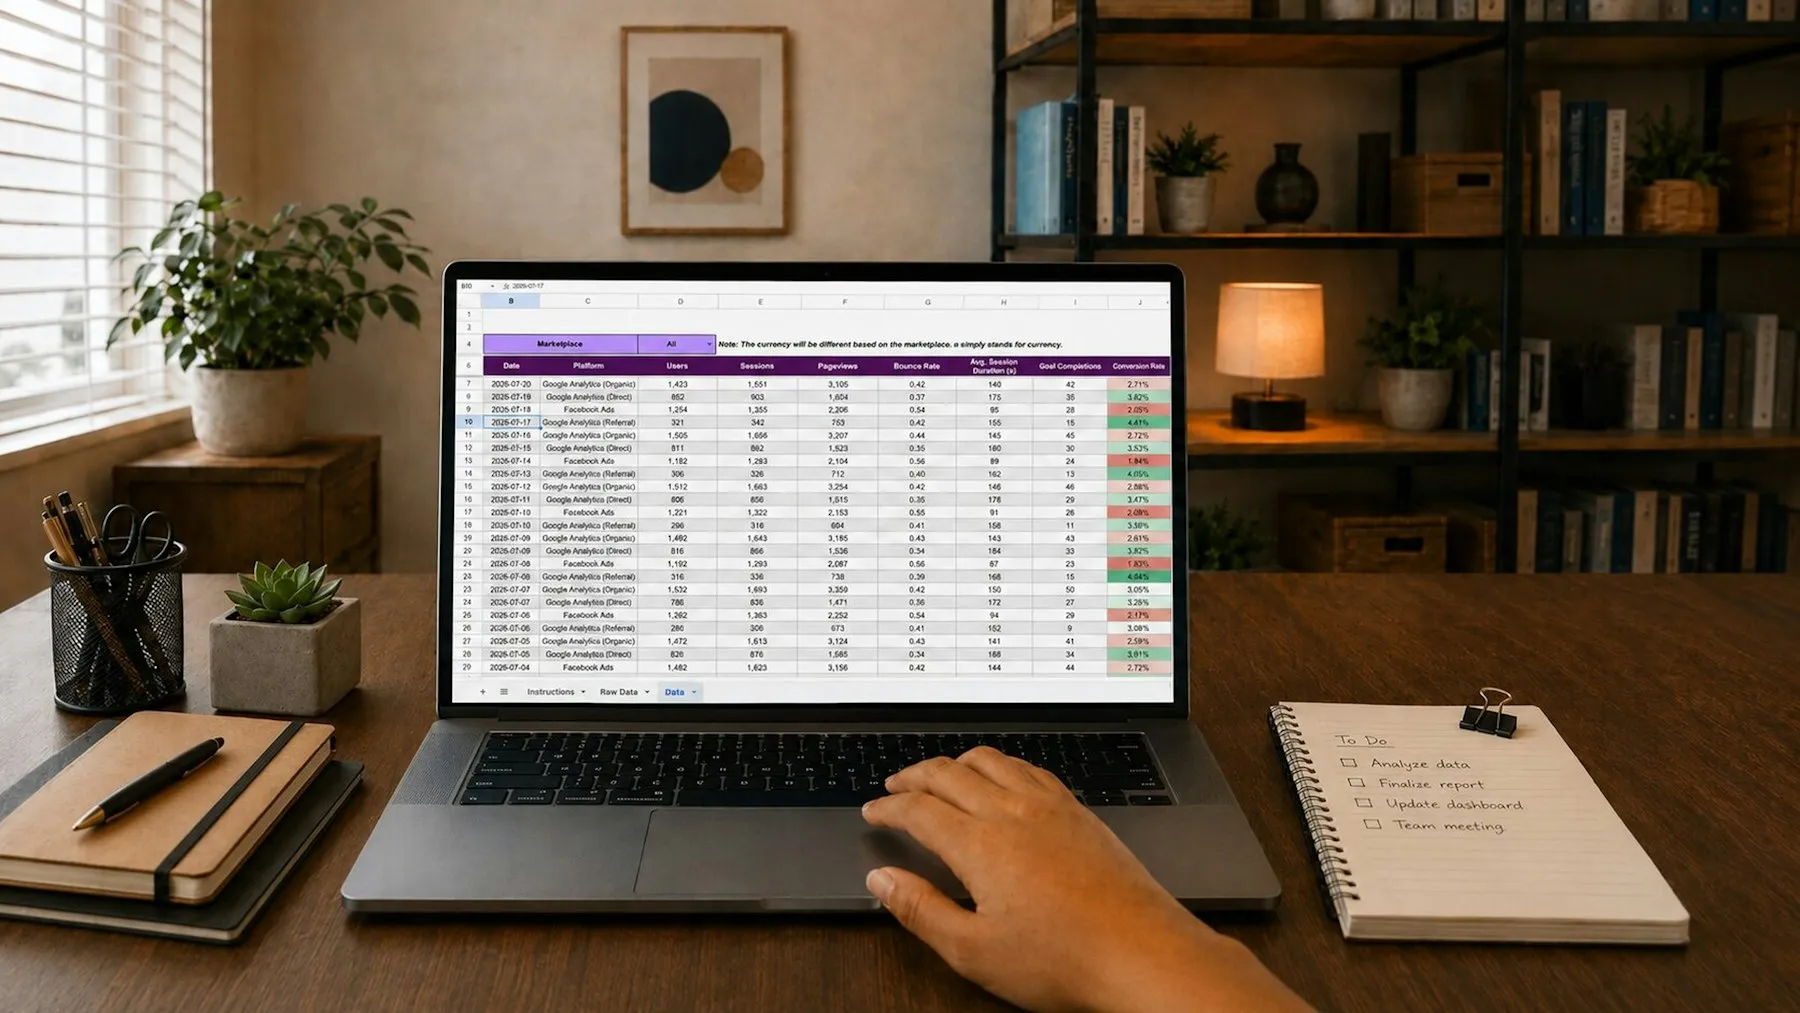 Three systems, one spreadsheet, every Monday
Someone copies figures from three systems into one spreadsheet. Scheduled imports do it instead, and a failed import is flagged on the dashboard.
Both are right by their own definition. Each metric gets a written source, formula, time zone and exclusions before any chart is drawn.
How a job starts here

We start from the questions you answer every week, not the data that happens to exist.
Each metric is written down and checked against a month you already know.
The path
Not sure whether it fits inside a platform we run or needs its own app? A System review answers it.
We check the first figures against your spreadsheet until they match, or the difference is explained.
Dashboard and reports go live. On a Run plan, we watch the data syncs.
Who it is for

When all your data lives in Google Analytics and one spreadsheet, a custom build would cost more than the problem.
Use a free tool such as Looker Studio.
The numbers are wrong at the source because the work is not captured anywhere.
Fix how the work is captured first, as a Custom Platforms & Portals project.
In production
FAQ
Tell us where the numbers live today. We will talk through one screen that updates itself, with numbers everyone reads the same way.
Step 1 of 2
Two quick steps: what is going on, then where to send our reply. An engineer reads it and tells you honestly if we are not the right fit.
Which of these is closest?
Two steps. We ask for an email on the next one.
An engineer reads it and usually answers the same working day. In the meantime, feel free to explore.
Cookies
Before you go — have a system that's stuck, or needs AI?
We build what's missing, add AI where it really helps, and keep it all running.